Pie chart
The pie chart allows network elements for a specific KPI to be ranked, such as top circuit loads, business / leisure traffic repartition or top 10 sites for a specific application response time. You can choose and display top elements based on a specific KPI, or sort top elements based on one KPI and display another KPI (for example: application response time for my top 10 traffic sites).
Create a pie chart dashlet by clicking
 in the edition tool bar.
in the edition tool bar.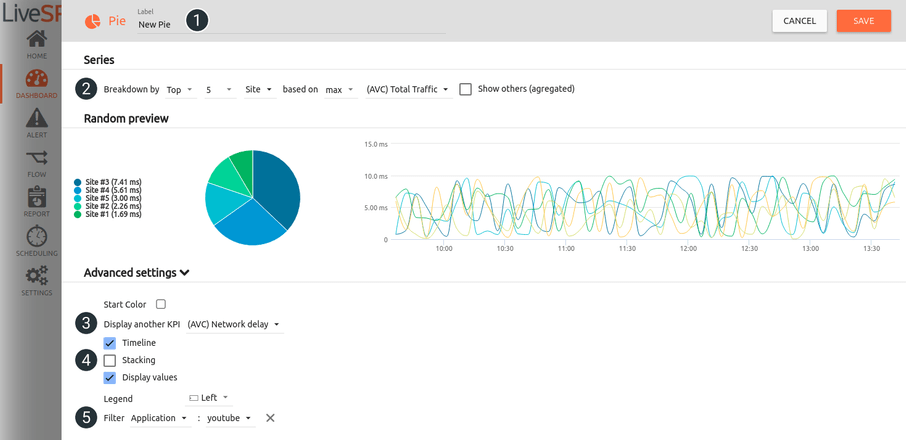
1. Name your dashlet.
2. Select the KPI from the KPI library.
3. Display another KPI.
4. Customize your layout by adding a timeline visualization to the pie (the same elements will be displayed) and its values.
5. Filter the data set.